


B2B sales KPIs: the leading and lagging metrics worth tracking
Measure the activity, not just the result
The short answer
Track leading indicators (contacts reached, replies, conversations) alongside lagging ones (deals, revenue). Revenue alone tells you about a problem too late to fix it. Whatever you measure is what you will get, so measure carefully.
"How is sales going?" answered without numbers is answered by mood. Mood is a poor guide to a quarter.

On this page
- The sales KPIs at a glance
- Leading and lagging
- A workable set
- A worked example: one month of numbers
- Sales KPI benchmarks: what normal looks like
- The metric shapes the behaviour
- Two common failures
- Common sales KPI mistakes and fixes
- Numbers need volume and clean data
- Make them visible
- A weekly KPI review in fifteen minutes
- "My team is too small for sales metrics"
The sales KPIs at a glance
A small B2B team can steer on eight numbers. Leading indicators move first and can be fixed this week. Lagging indicators confirm the result and arrive too late to fix.
| KPI | Type | How to calculate it | What it tells you |
|---|---|---|---|
| Contacts reached | Leading | Delivered emails, connected calls and accepted LinkedIn requests | Whether activity is going to the right accounts |
| Reply rate | Leading | Replies divided by contacts reached, auto-replies removed | Whether message and list match |
| Positive reply rate | Leading | Interested replies divided by genuine replies | Whether the list is right, not just responsive |
| Conversations started | Leading | Replies that became a real exchange with a person who fits the ICP | Whether outreach creates pipeline |
| Meetings held | Leading | Meetings that took place, matched to the ICP | Whether bookings turn into attendance and fit |
| Win rate | Lagging | Deals won divided by deals closed | Whether qualification is checking or rubber-stamping |
| Sales cycle length | Lagging | Days from first meeting to close | Where deals stall and how long cash takes |
| Revenue | Lagging | Closed-won value in the period | Whether the system works; reported too late to steer |
For the numbers an outbound programme should report, read what your lead generation agency should report weekly. For the stages behind these metrics, see B2B funnel stages, sales and demand generation and MQL and SQL explained.
Leading and lagging
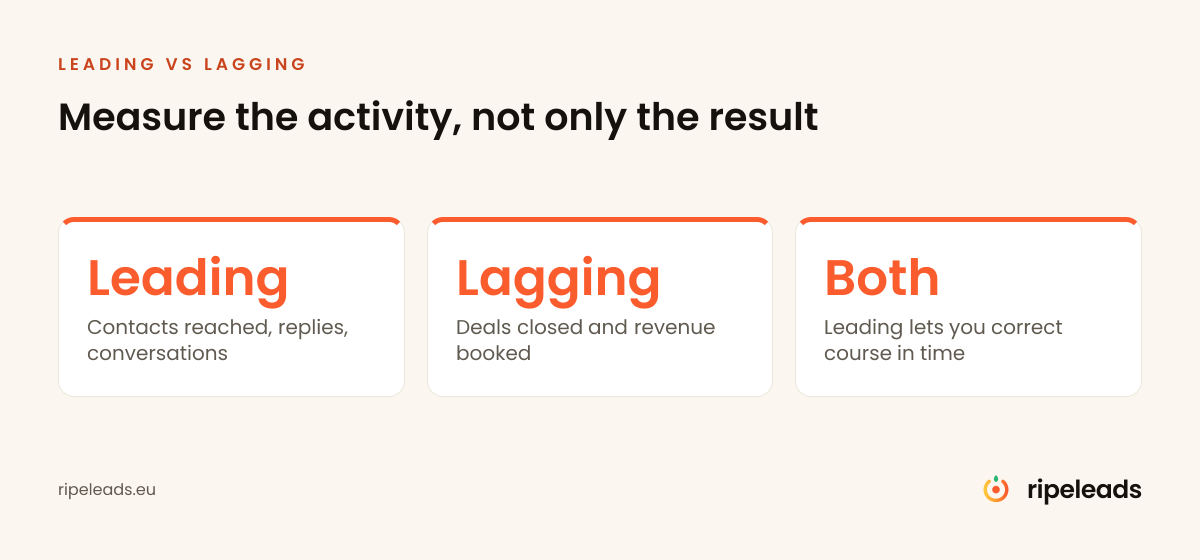
Lagging indicators, deals and revenue, confirm what already happened. Leading indicators, contacts reached and conversations started, predict what is coming.
Tracking only revenue is like driving using the rear-view mirror. By the time the number moves, the cause is weeks behind you.
A workable set
Enough to cover the whole pipeline without drowning anyone:
- Contacts reached, the volume of activity.
- Reply and conversation rate, quality of targeting and message.
- Stage-to-stage conversion, where things stall.
- Deals and revenue, the final result.
The first two items are the KPIs that matter for outbound lead generation specifically, and they are the numbers a BDR is measured on before any deal has closed.
A worked example: one month of numbers
Say your team reached 1,000 new contacts in a month. Forty replied, twelve of those turned into conversations, four became qualified opportunities, one closed. Each ratio in that chain tells you something different.
A 4% reply rate says the targeting and message are workable. Twelve conversations from forty replies says roughly a third of replies were worth having, which is normal for cold outbound. Four opportunities from twelve conversations is a healthy qualification rate. One close from four opportunities proves nothing yet at this volume, so you watch it rather than react to it.
Now run the same month with only revenue on the dashboard: one deal. Good month or bad month? You cannot tell. The chain of leading indicators is what turns a single number into a diagnosis.
Sales KPI benchmarks: what normal looks like
Ranges vary so much by market, offer and list quality that a published benchmark is rarely the right yardstick. The useful comparison is your own last campaign. In the campaigns we run, cold email replies sit in the low single digits as a share of contacts reached, only a part of those replies is positive, and a minority of positive replies turns into a booked meeting. Qualification done before the call rather than during it lifts the meeting-to-opportunity step noticeably. If you have no history yet, set no target for the first campaign and let it produce your baseline.
When a number sits far outside these ranges, look at the stage directly before the weak one first. A poor meeting rate is usually a reply-quality problem, and a poor reply rate is usually a list problem. Our guide to outbound benchmarks covers the full set stage by stage.
The metric shapes the behaviour
This is the part managers underestimate: you get what you measure.
Measure calls made and you get many fast, shallow calls. Measure only closed deals and the activity that creates them goes unmanaged. A good set balances volume with quality so that improving the number improves the business.
Two common failures
Measuring only the end result, so problems surface too late to act on. And creating perverse incentives, where hitting the metric and doing good work pull in opposite directions. Both are fixed by a balanced set rather than a single headline number.
Common sales KPI mistakes and fixes
- Too many metrics. A dashboard with twenty numbers gets ignored. Fix: four to six, reviewed every week without exception.
- Vanity metrics. Emails sent and calls dialled measure effort, not progress. Fix: pair every volume metric with a quality metric that depends on the prospect responding.
- Fuzzy stage definitions. If "qualified" means something different to each rep, your conversion rates are noise. Fix: written definitions everyone signs off on, along the lines of MQL and SQL.
- Changing metrics every month. A trend needs several weeks of consistent measurement before it means anything. Fix: commit to one set for a quarter, then review the set itself.
- Using KPIs as punishment. Once numbers are used to assign blame, people manage the numbers instead of the work. Fix: treat a weak metric as a targeting or process question, not a character question.
Numbers need volume and clean data
KPIs are only meaningful with enough activity behind them and a CRM worth trusting. Conclusions drawn from a handful of deals, or from messy records, are guesses with decimal places.
Make them visible
A regular, plain report, built the way we lay out in our outbound reporting dashboard guide, means the team and the manager are looking at the same picture and arguing about facts rather than impressions. Transparency about numbers is a sign of a healthy sales culture, not surveillance.
A weekly KPI review in fifteen minutes
Sales metrics only steer behaviour if someone looks at them on a schedule. A workable weekly routine:
- Check activity first. Contacts reached versus plan. If activity is short, nothing downstream matters yet.
- Check reply and conversation rates. A drop here flags a message or list problem before it reaches the pipeline.
- Check stage conversions. Find the one stage that moved most since last week and ask why.
- Check pipeline coverage. Enough open value to make the quarter, given your usual win rate. This feeds straight into forecasting from your pipeline.
- Pick one action. One fix per week, applied and measured, beats five discussed and forgotten.
"My team is too small for sales metrics"
A common objection, and understandable at two or three people. The reality: small teams need leading indicators more, not less. A large team's revenue smooths out luck. A small team's revenue is mostly noise, so two closed deals in a quarter tells you almost nothing, while 800 contacts reached at a 3% reply rate is real information you can act on next week.
Keep the setup light. A spreadsheet with weekly activity, replies, meetings and deals is enough for B2B sales management at that size. What matters is that the same numbers get written down every week and that every lost deal gets a reason attached, which is where win-loss analysis starts.
This ties into what we wrote in Sales agent vs distributor vs direct sales in export markets.
Frequently asked
Which KPIs should a B2B sales team track?
What is the difference between leading and lagging indicators?
What is the most common mistake with sales KPIs?
What KPIs matter specifically for B2B lead generation?
How often should you review outbound reporting metrics?
Are open rates worth tracking in outbound reporting?
How do you calculate win rate in B2B sales?
What is the difference between a KPI and a metric?
How many sales KPIs should a small team track?
Rather not build this yourself?
We run the targeting, data, copy and follow-up as a done-for-you service, and send the interested replies straight to your inbox. You bring the close.
Book a strategy call Or get a free target list first