


B2B sales funnel stages and how they map to a demand generation funnel
B2B sales funnel stages, and where deals actually stall
The short answer
A B2B demand generation funnel and a sales funnel describe the same journey from two ends: marketing names the earlier stages demand generation, sales picks up from first contact. A funnel is a diagnostic tool, not a diagram. Define stages that match how you actually sell, then read the conversion between them: the weakest transition tells you what to fix. Deals usually stall because of poor qualification, dropped follow-up, or no defined next step.
Most teams can tell you their revenue. Far fewer can tell you which step in their process is losing it.

On this page
- Funnel stages mapped
- What the funnel is for
- Stages that reflect reality
- Your stages, not a textbook's
- Qualification is a real stage
- Why deals stall
- The top of the funnel decides the rest
- What healthy conversion between sales funnel stages looks like
- A worked example: 1,000 contacts to closed deals
- MQL, SQL and the handover problem
- Common sales funnel mistakes, with fixes
- A 20-minute weekly pipeline review
- How this plays out across Europe
B2B funnel stages mapped to the demand generation funnel
The two funnels describe one journey from two ends. Marketing names the early stages, sales picks up from first contact. Use the table to place a contact and find the owner and the number to watch.
| Stage | Demand generation name | Owner | What moves it forward | Number to watch |
|---|---|---|---|---|
| Unaware | Awareness | Marketing | Familiarity with the company | Reach in the target accounts |
| Interested | Interest and engagement | Marketing | A specific action or stated need | Replies and sign-ups that fit the ICP |
| First conversation | Marketing qualified lead handed over | Marketing to sales | A written handover with the reason for qualification | Acceptance rate of handed-over leads |
| Qualified opportunity | Sales qualified lead | Sales | Budget, authority, need and timing confirmed | Qualified opportunities created |
| Proposal | Pipeline | Sales | A defined next step with a date | Conversion between stages |
| Closed | Won or lost | Sales | A decision | Win rate and cycle length |
The handover between the first two owners is covered in MQL and SQL explained. The weekly numbers are in B2B sales KPIs, and the contacts that stall in the middle in how to respond to a not interested email.
What the funnel is for
It answers three questions: how many opportunities exist at each stage, where they are getting stuck, and how many deals you can reasonably expect. Without that, pipeline is managed on intuition, and intuition is confident and often wrong.
Stages that reflect reality
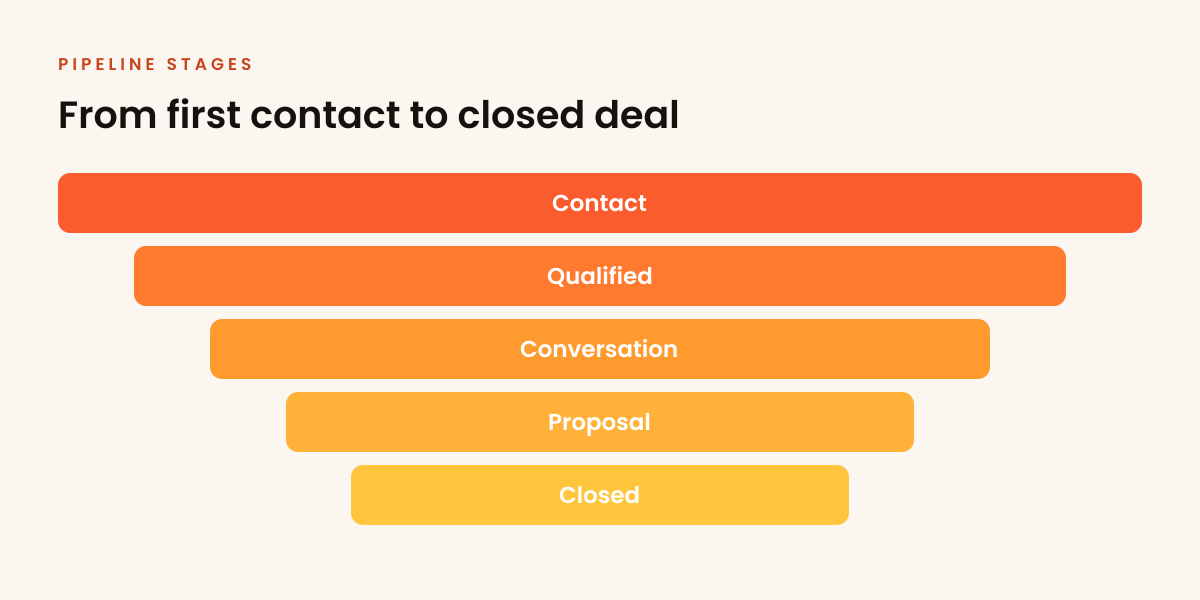
The classic shape runs from broad awareness down to a decision. In practice a B2B pipeline is more concrete:
Your stages, not a textbook's
The most important rule: stages must describe how your customers actually buy. A funnel copied from a template and never matched to reality produces tidy reports and useless forecasts. Much of the buying now happens before a seller is involved at all, so it is worth checking your stages against how B2B buying actually happens now.
Qualification is a real stage
Not every contact deserves a salesperson's time. Somewhere between interest and opportunity there has to be a written test: does this company fit the ICP, is there a real problem, is there budget and authority.
Without a written rule that both teams accept, that judgment is made differently by every person on every day, and the forecast reflects that. This is where sales and marketing alignment stops being a slogan and starts being a document.
Why deals stall
A deal sitting in one stage for weeks without movement is usually already lost, just not recorded as such. Three causes cover most of it:
- It was never qualified properly, the need was not there.
- Follow-up stopped, nobody picked it back up in time.
- There was no defined next step, the conversation ended on "we will be in touch."
The top of the funnel decides the rest
No closing technique rescues an empty pipeline. If the top is filled irregularly, the whole funnel pulses between overloaded and empty, and forecasting becomes guesswork.
Teams often optimise the bottom, the closing, when the constraint is at the top. Fix supply first, then technique, and be honest about whether the gap you are filling calls for demand generation or lead generation.
What healthy conversion between sales funnel stages looks like
Exact numbers vary so much by market, deal size and channel that quoting an industry figure would mislead you. What helps instead is the shape of the drop-off. From cold outbound, positive replies are a small fraction of everyone contacted. A minority of those conversations turn out to be genuine opportunities. A qualified opportunity reaches proposal fairly often when the fit is real, and a proposal closes less often than that, with the offer and the price doing most of the work at the last step.
Treat these as orientation, not targets. The better move is to measure your own rates for two or three months, then compare each transition against its own history. A stage converting at half its usual rate is the stage to investigate this quarter. Wider context on what B2B outbound produces sits in our outbound benchmarks guide.
A worked example: 1,000 contacts to closed deals
Numbers make the funnel concrete. Say a campaign contacts 1,000 well-targeted prospects. At a 3% positive reply rate, that is 30 conversations. If half qualify, you hold 15 real opportunities. If half of those reach proposal, you send 7 or 8. If a third of proposals close, the campaign ends with 2 or 3 new customers.
Now run the diagnostic in reverse. Two deals from 1,000 contacts sounds thin until you price it: at a €10,000 annual contract value, the campaign paid for itself several times over. And each stage points to a different fix. A weak reply rate points at list quality and copy. A weak qualification rate points at targeting. A weak close rate points at offer and pricing. The funnel tells you which conversation to have with your team.
MQL, SQL and the handover problem
Larger teams add labels between the stages: marketing-qualified lead, sales-qualified lead. The labels are useful when both teams agree on what they mean and harmful when they do not, because every dispute about "bad leads" is usually a definitions dispute in disguise. If your pipeline has a handover between marketing and sales, write the criteria down and revisit them quarterly. The full breakdown is in MQL and SQL explained.
Common sales funnel mistakes, with fixes
- Too many stages. Ten stages produce ten arguments about where a deal sits. Fix: five or six stages that map to observable buyer behaviour.
- Stages defined by seller activity. "Demo booked" records what you did, not what the buyer committed to. Fix: define each stage by something the buyer did, agreed to, or provided.
- No exit criteria. If a deal can sit in "negotiation" for six months, the stage means nothing. Fix: written entry and exit rules for every stage, one line each.
- Zombie deals inflating the pipeline. Old deals kept open to make the number look healthy. Fix: a time limit per stage; past it, the deal moves to closed-lost or a nurture track.
- Forecasting from gut feel. "This one feels like 80%" is not a method. Fix: forecast from stage counts and historical conversion, as covered in forecasting from your pipeline.
A 20-minute weekly pipeline review
A funnel only diagnoses anything if someone reads it. One short review per week covers it:
- Count new opportunities added this week. Below plan means a top-of-funnel problem, whatever the close rate says.
- List deals with no activity in 14 days. Each one gets a dated next step or gets closed. No third option.
- Check the weakest stage transition against its trailing three-month average.
- Confirm every open deal has a named next step with a date the buyer agreed to.
- Update the forecast from stage counts and conversion rates, not from optimism.
Track the same few numbers every week and trends appear within a quarter. Which numbers deserve the attention is covered in the KPIs worth tracking.
How this plays out across Europe
Funnel shape stays constant across markets; funnel speed does not. In the DACH region, buying committees tend to be larger and evaluation more formal, so the middle stages stretch and a deal that closes in four weeks in the Baltics can take a quarter in Germany. Neither is wrong. The mistake is averaging them: if you sell into several European markets, keep one stage structure but read conversion rates and stage duration per market. Ripe Leads runs campaigns in English, German, Lithuanian and Russian, and the same offer routinely moves through the same funnel at visibly different speeds depending on the country.
See also: a go-to-market strategy that survives contact, define the ICP behind the funnel and what an SDR actually does.
Frequently asked
What are the stages of a B2B sales funnel?
Why do deals get stuck in the pipeline?
How do I forecast from my funnel?
How is a demand generation funnel different from a sales funnel?
What is the B2B buyer journey?
How many people are involved in a B2B buying decision?
What is the difference between a sales funnel and a demand generation funnel?
Which funnel stage should I fix first?
Rather not build this yourself?
We run the targeting, data, copy and follow-up as a done-for-you service, and send the interested replies straight to your inbox. You bring the close.
Book a strategy call Or get a free target list first